I think it’s safe to say at this point everyone and their dog’s dog has heard in some form or another about the Mandiant report released entitled “APT1: Exposing One of China’s Cyber Espionage Units”. Regardless of what you think of the report – Jeffrey Carr has a good rebuttal – the one thing it does give us is a LARGE amount of indicators which can be made into actionable intelligence and I HIGHLY commend Mandiant on sharing this intelligence!
NOTE: I’m a bit late on getting to this blog post, I initially started writing it once the Mandiant report came out but unfortunately real life got in the way and thus this got delayed in publishing. So rightfully so there are already a number of great articles on making this intelligence actionable floating around the interwebs, here are a few of my favorites:
Mandiant’s APT1 Domain/MD5 Intel and Security Onion with ELSA by Brad Shoop
Active and Passive Mandiant APT1 Monitoring by Ron Gula
Making the Mandiant APT1 Report Actionable by Chris Sanders
So now here’s how I took those indicators and turned them in to actionable intelligence and alerts using Splunk…
The absolute best thing about the report was that Mandiant was kind enough to provide IOC’s (Indicators Of Compromise) bundled along side their report so I wrote a small script to strip out data from the IOC’s that would be meaningful to me. What I was looking to do with this was create a CSV file that contained the following data: Domain Names, MD5 sum’s, File Names, File Size’s and Notable String’s. When it was all said and done here’s a sample of what I ended up with:
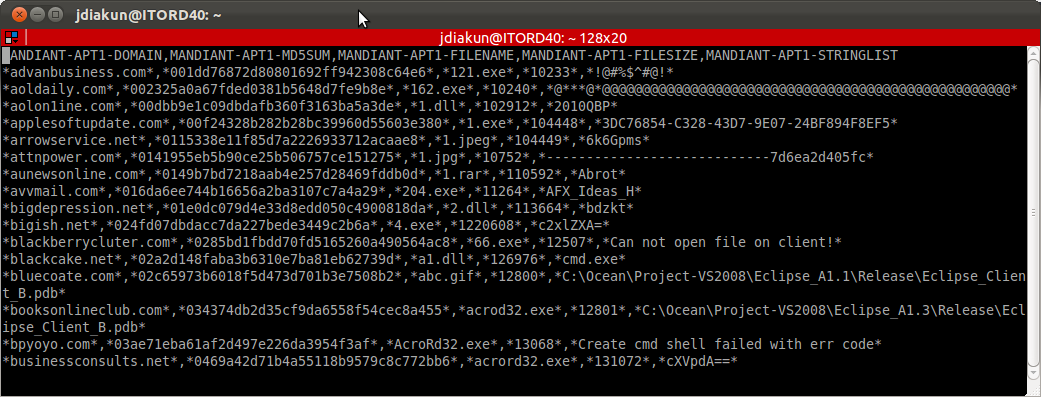
NOTE: You can find the file attached here
You’ll notice that within the file all the extracted data is surrounded by asterisks (*), this is a bit of a cheat so that when we use the lookup it’s a wildcard match (shown later).
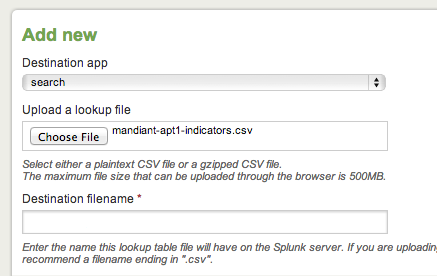
Next, using that CSV file let’s create a lookup in Splunk… Click on Manager -> Lookups -> Lookup table files -> New … on the next screen choose the destination application you would like this lookup associated with (for the purposes of this, choose “search”) then click browse and choose the CSV file mentioned in the previous step and finally you can choose to give it a new name on the server or leave as is (for the purposes of this, leave it blank). Click Save.
Now that the lookup has been created it’s time to make use of this intelligence.
The first obivous thing to do is make use of the domain data. The best place to look for domains? DNS logs 🙂
If you do not already have your DNS servers logging queries, well this is the first most advisable step. The following URL is a great article that describes enabling DNS logs on a Windows Domain Controller, getting the data in to splunk and formatting the log events correctly (and even beyond that to detect malware domains):
http://stratumsecurity.com/2012/07/03/splunk-security/
If you’re using BIND DNS then you’ll need to make some changes to named.conf to enable query logging, as outlined in the URL below, then make sure the logs are being ingested by Splunk and fields extracted accordingly.
http://stackoverflow.com/questions/11153958/how-to-enabled-named-bind-dns-full-logging
After the DNS logs are in Splunk a search can now be run to see if any of the domain data from the lookup previously created matches any of the domain’s that exist in the DNS logs. Here’s a simple search that does exactly that:
sourcetype=dns_query [ | inputlookup mandiant-apt1-indicators.csv MANDIANT-APT1-DOMAIN | rename MANDIANT-APT1-DOMAIN as domain | fields + domain ]
This search will return results where the domain field in the DNS events matches the renamed domain field in the lookup. Now go ahead and run this search on your back-dated data and configure any alerts for data as it comes in real-time then sit back and cross your fingers there are never any results 🙂
Now instead of relying on exact field value matching let’s make use of the ‘return‘ command and search for just the matching strings in our logs, this is where the cheat I mentioned previously where I added the asterisk’s to the CSV file comes in to play. Let’s slightly modify our previous search to now make use of the ‘return‘ command:
sourcetype=dns_query [ | inputlookup mandiant-apt1-indicators.csv | rename MANDIANT-APT1-DOMAIN AS APT1DOMAIN | return $APT1DOMAIN ]
…Thats all we need to do now. Note the MANDIANT-APT1-DOMAIN field is renamed as APT1DOMAIN because the ‘return‘ command does not play well with dashes ( – ). The search will now look for all occurences of the value of MANDIANT-APT1-DOMAIN in the dns_query events and return any matches — pray for none 🙂
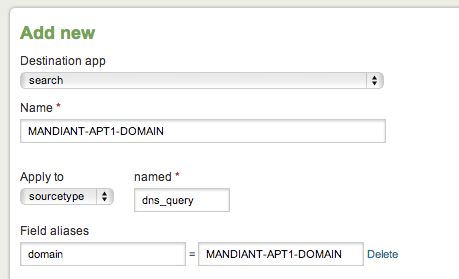
But going back to the field matching search… If you did not want to have to remember to rename the fields inside the lookup file each time to match those that exist in your search then an easier way is to create a Field Alias in Splunk. Click Manager -> Fields -> Field Alias -> New … on the next screen choose the destination application in Splunk (for purposes of this choose “search”), fill out the name you want to give this Field Alias, choose what you want it to apply to (for purposes of this, sourcetype = dns_query) and then specify the original field and the new field alias.
Now you can setup field aliases for all sorts of sourcetype’s that may have IP/domain data in such as proxy logs, network packet captures, etc… then you simply just need to combine the sourcetype’s wiht the previous search like so:
sourcetype=dns_query OR sourcetype=proxy [ | inputlookup mandiant-apt1-indicators.csv MANDIANT-APT1-DOMAIN | fields + $MANDIANT-APT1-DOMAIN ]
And now sit back and once again hope for no results 🙂
From here you can see how to begin to setup searches using the indicators in the CSV against the data you have. Of course there can always be false positives that come about, but with enough tuning and added intelligence these alerts can prove extremely beneficial.
More example alerts:
1. Filename indicators in proxy logs or running processes:
sourcetype=proxy OR sourcetype=running_process [ | inputlookup mandiant-apt1-indicators.csv MANDIANT-APT1-FILENAME | fields + MANDIANT-APT1-FILENAME ]
2. Search for matching domains AND filenames in proxy logs:
sourcetype=proxy [ | inputlookup mandiant-apt1-indicators.csv | rename MANDIANT-APT1-DOMAIN, AS APT1DOMAIN, MANDIANT-APT1-FILENAME AS APT1FILENAME | return $APT1DOMAIN, $APT1FILENAME ]
3. Add in even more certainty by matching domains, filenames and file size’s in proxy logs:
sourcetype=proxy [ | inputlookup mandiant-apt1-indicators.csv | rename MANDIANT-APT1-DOMAIN AS APT1DOMAIN, MANDIANT-APT1-FILENAME AS APT1FILENAME, MANDIANT-APT1-FILESIZE AS APT1FILESIZE | return $APT1DOMAIN, $APT1FILENAME, $APT1FILESIZE ]
4. Search for String indicators in Windows event/application logs:
LogName=Security OR LogName=System OR LogName=Application [ | inputlookup mandiant-apt1-indicators.csv | rename MANDIANT-APT1-STRINGLIST AS APT1STRINGLIST | return $APT1STRINGLIST ]
5. If you’re making use of something like OSSEC’s bundled Syscheck functionality for integrity checking (which is definitely always a good idea) then you can search for Filenames and matching MD5sums that may have appeared:
sourcetype=ossec [ | inputlookup mandiant-apt1-indicators.csv | rename MANDIANT-APT1-FILENAME AS APT1FILENAME, MANDIANT-APT1-MD5SUM AS APT1MD5SUM | return $APT1FILENAME, $APT1MD5SUM ]
…more to come!
Hope this helps and let me know of any questions/comments. Happy Hunting.